

In today’s data-driven world, information is collected everywhere. Businesses track customer behavior, hospitals monitor patient outcomes, schools measure student performance, and governments rely on population data for planning. However, raw data on its own often looks messy, confusing, and difficult to interpret. This is where descriptive statistics becomes essential. It helps researchers, analysts, students, and organizations organize large amounts of data into meaningful summaries that are easier to understand and use for decision-making.
Descriptive statistics is one of the oldest and most widely used branches of statistics. It focuses on summarizing, organizing, and presenting data in a meaningful way without making predictions about larger populations. When someone calculates averages, identifies trends, studies variability, or creates charts and graphs, they are often using descriptive statistical methods. It serves as the foundation of data analysis because before drawing conclusions or making forecasts, analysts need to understand what their existing data is showing.
The importance of descriptive statistics has increased significantly with the rise of big data, artificial intelligence, machine learning, healthcare analytics, business intelligence, and academic research. Companies use descriptive analytics to understand customer purchasing patterns, researchers summarize survey findings, and financial institutions study market behavior using statistical summaries. Whether the dataset contains ten observations or millions of records, descriptive statistics provides clarity by transforming raw numbers into useful insights.
This article explores descriptive statistics in depth, including its definition, major concepts, formulas, methods, types of distributions, practical applications, limitations, and role in modern industries. By understanding descriptive statistics thoroughly, individuals can improve their analytical skills and make more informed decisions based on reliable data interpretation.
What Is Descriptive Statistics?
Descriptive statistics refers to statistical techniques used to summarize, organize, and describe the characteristics of a dataset. Rather than making assumptions or predictions about a larger population, descriptive statistics focuses solely on the data that has already been collected. It helps present information in a simpler format so users can identify patterns, trends, and relationships quickly.
For example, if a teacher collects test scores from students in a classroom, descriptive statistics can help determine the average score, highest score, lowest score, score distribution, and overall performance trends. Similarly, a retail company may analyze monthly sales figures to understand average revenue and customer purchasing behavior.
The primary goal of descriptive statistics is to reduce large quantities of data into meaningful summaries without losing critical information. Raw datasets may contain hundreds or thousands of observations, making manual interpretation difficult. Through averages, percentages, graphs, and spread measurements, descriptive statistics simplifies analysis.
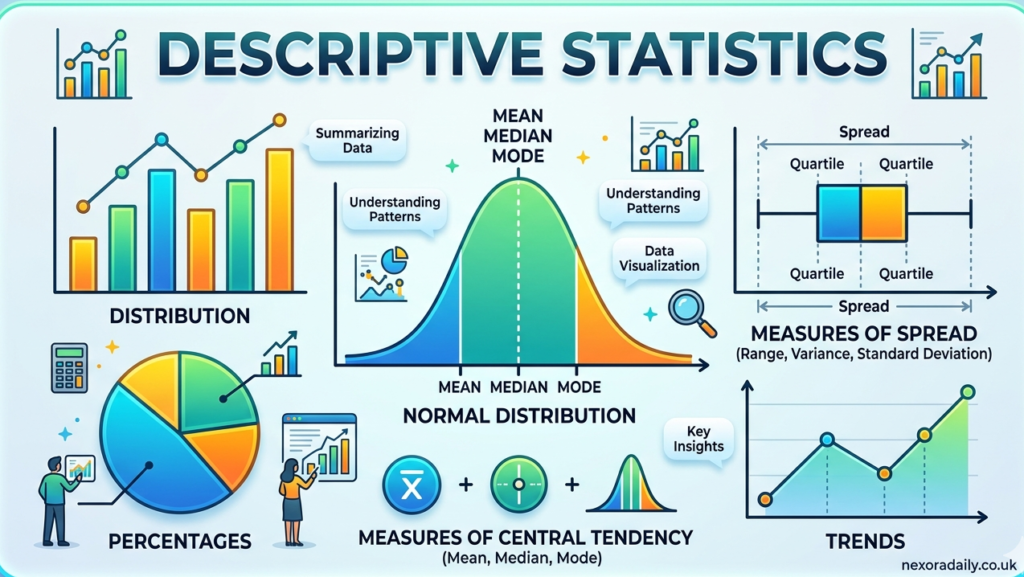
Researchers often divide descriptive statistics into two major categories: measures of central tendency and measures of variability. In addition, graphical methods and frequency distributions help present findings visually. These tools collectively make descriptive statistics one of the most practical branches of mathematics and analytics.
History and Evolution of Descriptive Statistics
The roots of descriptive statistics can be traced back to ancient civilizations where rulers collected population, tax, and agricultural records. Ancient Egyptians used numerical records to track land ownership and taxation, while the Roman Empire conducted censuses to manage resources and military planning.
During the 17th and 18th centuries, descriptive statistical methods became more formalized. Scholars such as John Graunt analyzed birth and death records to understand population trends. Graunt’s work on mortality records is often considered one of the earliest examples of modern statistical analysis.
Later, Karl Pearson contributed significantly to statistical theory by developing concepts such as standard deviation and correlation. His work helped shape modern descriptive analytics.
Today, descriptive statistics has evolved through computer science advancements. Software programs such as Microsoft Excel, IBM SPSS Statistics, R, and Python allow analysts to process large datasets quickly and accurately.
Types of Data Used in Descriptive Statistics
Understanding descriptive statistics requires understanding the types of data being analyzed. Data is generally divided into qualitative and quantitative categories. Qualitative data includes non-numerical information such as gender, product categories, customer preferences, and education levels.
Quantitative data includes numerical values and is further divided into discrete and continuous data. Discrete data includes countable values such as number of students or number of products sold. Continuous data includes measurable values such as height, income, temperature, and time.
Descriptive statistics techniques vary depending on the type of data. Frequency tables work well for categorical data, while numerical data often requires averages, dispersion measures, and graphical analysis.
Data can also be classified into nominal, ordinal, interval, and ratio scales. These classifications influence which statistical summaries are most appropriate for analysis.
Measures of Central Tendency
Measures of central tendency identify the central or typical value in a dataset. The three most common measures are mean, median, and mode.
The mean is calculated by adding all values and dividing by the total number of observations. For example, if five employees earn salaries of $40,000, $45,000, $50,000, $55,000, and $60,000, the average salary is $50,000. Mean is widely used in economics, education, healthcare, and market analysis.
xˉ=n∑x
The median represents the middle value when data is arranged in ascending order. It is useful when outliers distort averages. The mode identifies the most frequently occurring value in a dataset. Retail businesses often use mode analysis to determine their most frequently purchased products.
These measures provide quick insights into overall trends but must be interpreted alongside variability metrics for complete understanding.
Measures of Dispersion
Measures of dispersion explain how spread out data points are within a dataset. Two datasets may share the same average but have very different variability levels.
Range measures the difference between the highest and lowest values. For example, if employee salaries range from $30,000 to $90,000, the range is $60,000.
Variance measures the average squared deviation from the mean. Standard deviation, one of the most important descriptive statistics tools, shows how much values typically differ from the average.
σ=N∑(x−μ)2
A low standard deviation indicates consistency, while a high standard deviation suggests significant variability. These measures are critical in finance, risk management, and scientific research.
Frequency Distribution and Data Visualization
Frequency distribution shows how often values occur within specific intervals or categories. It helps summarize large datasets and identify trends quickly.
For example, a university may group exam scores into categories such as 50–60, 61–70, and 71–80 to better understand performance distribution. Frequency tables simplify raw datasets significantly.
Graphs and charts also improve data interpretation. Histograms display numerical distributions, while bar charts visualize categorical data. Pie charts show percentage distributions across categories.
Box plots help identify outliers and quartile ranges. Data visualization improves communication between analysts and non-technical decision-makers.
Skewness and Kurtosis in Data Distribution
Skewness measures the symmetry of data distribution. A normal distribution has zero skewness because both sides are balanced.
Positive skewness occurs when the tail extends toward higher values, often seen in income distribution where a small number of individuals earn significantly more than average.
Negative skewness occurs when the tail extends toward lower values. Understanding skewness helps analysts select appropriate statistical methods.
Kurtosis measures the heaviness of distribution tails. High kurtosis indicates more extreme outliers, while low kurtosis suggests fewer unusual observations.
These advanced metrics are commonly used in financial forecasting and scientific experiments.
Applications of Descriptive Statistics in Real Life
Descriptive statistics is used in nearly every industry. In healthcare, hospitals analyze patient recovery rates, average treatment costs, and disease patterns.
Businesses use descriptive analytics to evaluate customer retention, sales performance, and marketing campaigns. E-commerce companies study customer buying habits to improve product recommendations.
Financial institutions rely on descriptive statistics to evaluate historical stock performance, spending patterns, and credit risks.
Educational institutions analyze attendance rates, exam scores, and graduation statistics to improve learning outcomes.
Government agencies use population data, employment statistics, and inflation reports for economic planning.
Limitations of Descriptive Statistics
Although descriptive statistics is highly useful, it has limitations. It cannot explain why certain patterns occur because it only summarizes data.
It also cannot predict future outcomes or make conclusions about broader populations. For that, inferential statistics is required.
Poor data quality can also produce misleading summaries. Missing values, inaccurate records, and biased sampling can affect results.
Analysts should always combine descriptive methods with proper data validation techniques for reliable findings.
Descriptive Statistics in Modern Data Science
The rise of big data has made descriptive statistics more valuable than ever. Before machine learning models are built, analysts use descriptive methods to clean and understand datasets.
Data scientists rely on descriptive statistics for exploratory data analysis, feature engineering, and model preparation.
Platforms such as Tableau, Power BI, Python, and R help professionals automate statistical reporting.
As artificial intelligence continues to grow, descriptive statistics remains a foundational skill for interpreting complex datasets.
Conclusion
Descriptive statistics plays a critical role in simplifying data and making it easier to understand. From averages and standard deviation to histograms and frequency distributions, these methods help summarize complex information into meaningful insights.
Its applications span healthcare, education, finance, business intelligence, scientific research, and technology. Although it cannot predict future outcomes, it provides the foundation for deeper statistical analysis and better decision-making.
As organizations continue generating massive amounts of information, understanding descriptive statistics will remain essential for researchers, students, analysts, and businesses seeking data-driven success.